CHSB Technicals: Strong fundamentals, following Bitcoin or anticipating Smart Yield?

Fidel Velasco
Analyst
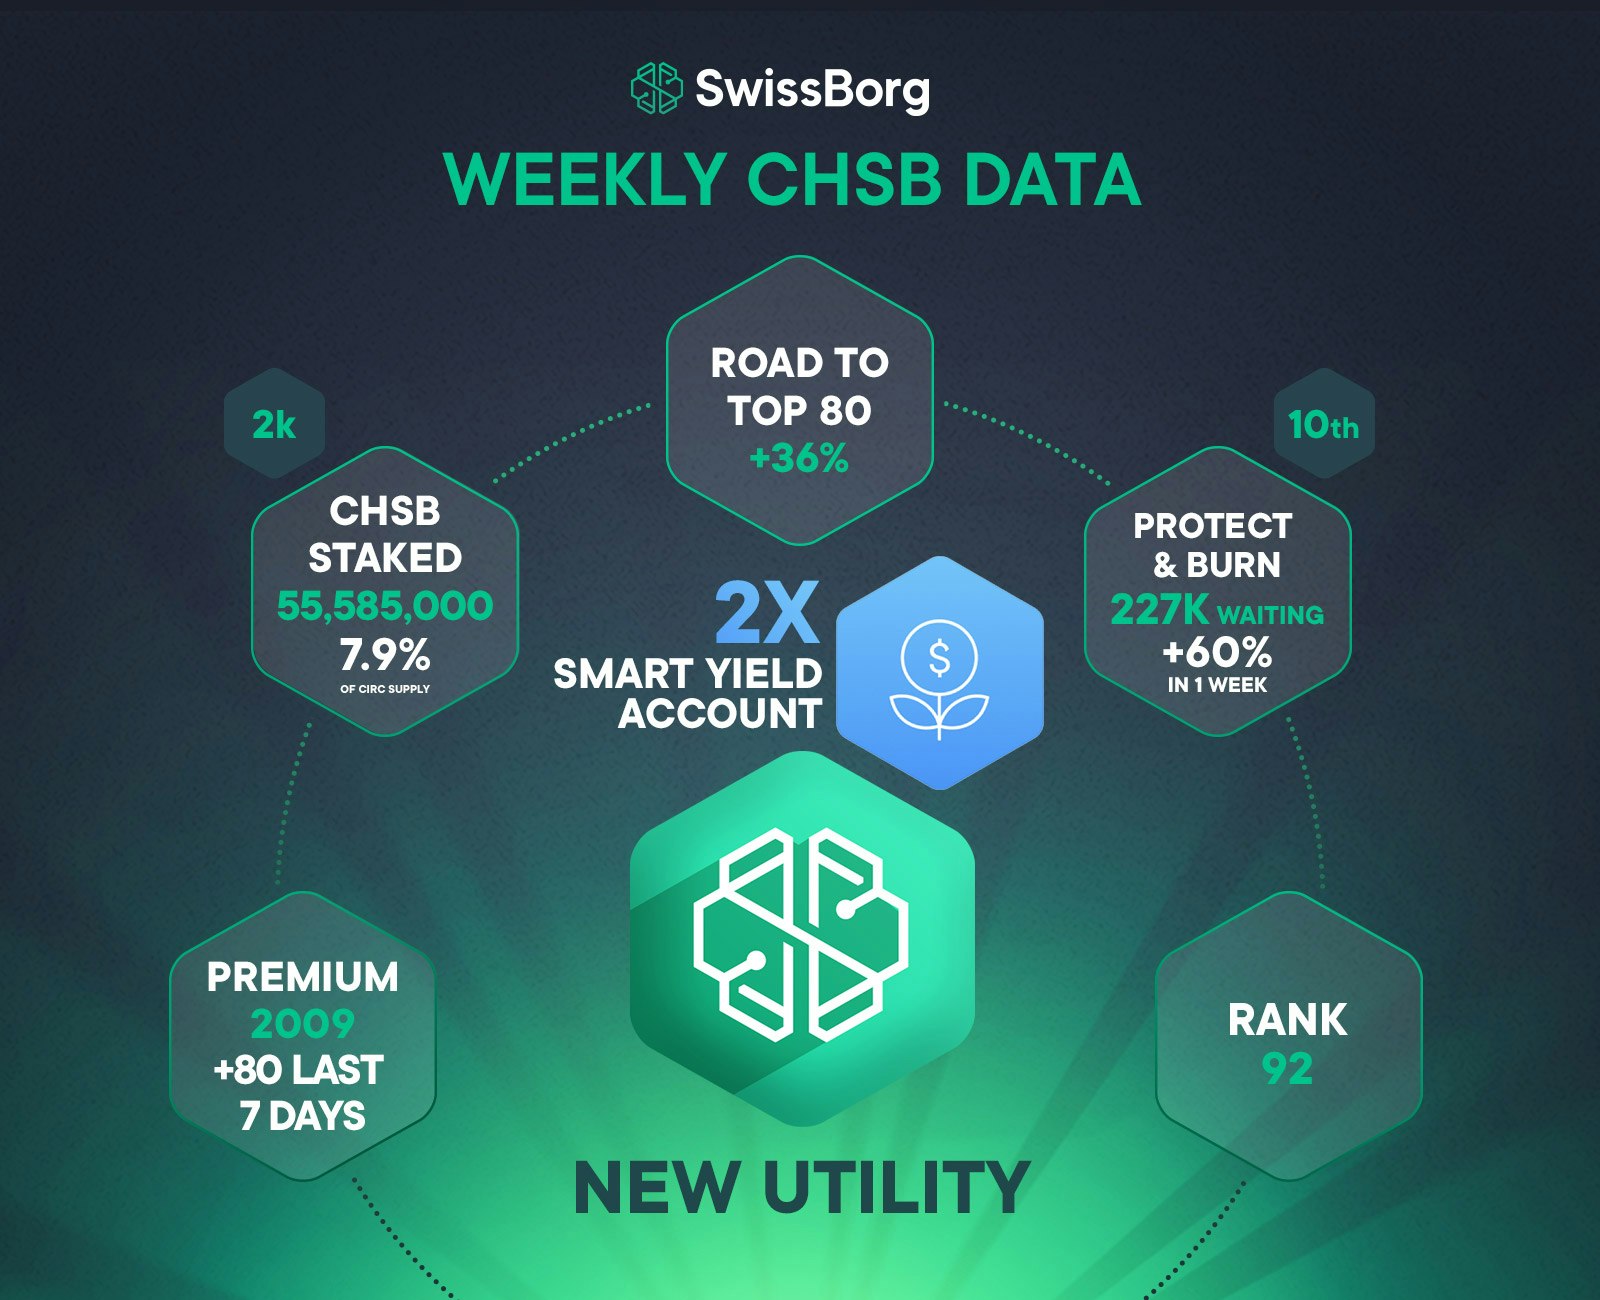
The CHSB token has achieved a series of milestones in the last few days:
- The number of CHSB staked is now above 55 million, which represents almost 8% of circulating supply!
- The number of Premium accounts has now reached 2,000 users! These are users who believe in the utility of the CHSB token and have decided to stake it for 12 months to access advantages like 0% fees on BTC, CHSB and stablecoin exchanges, and a double yield in our upcoming Smart Yield account.
- The volume in the SwissBorg app has skyrocketed since 5 November 2020, which has led to a 66% week-on-week increase in protect and burn reserves to be used when the CHSB price moves into a bearish zone.
- On 6 November 2020, the CHSB token regained its place among the top 100 cryptocurrencies on CoinMarketCap and on 17 November 2020, the CHSB token became the top 24 hour gainer on CoinMarketCap!

From a technical analysis and price action perspective, there have been quite a few positive developments as well.
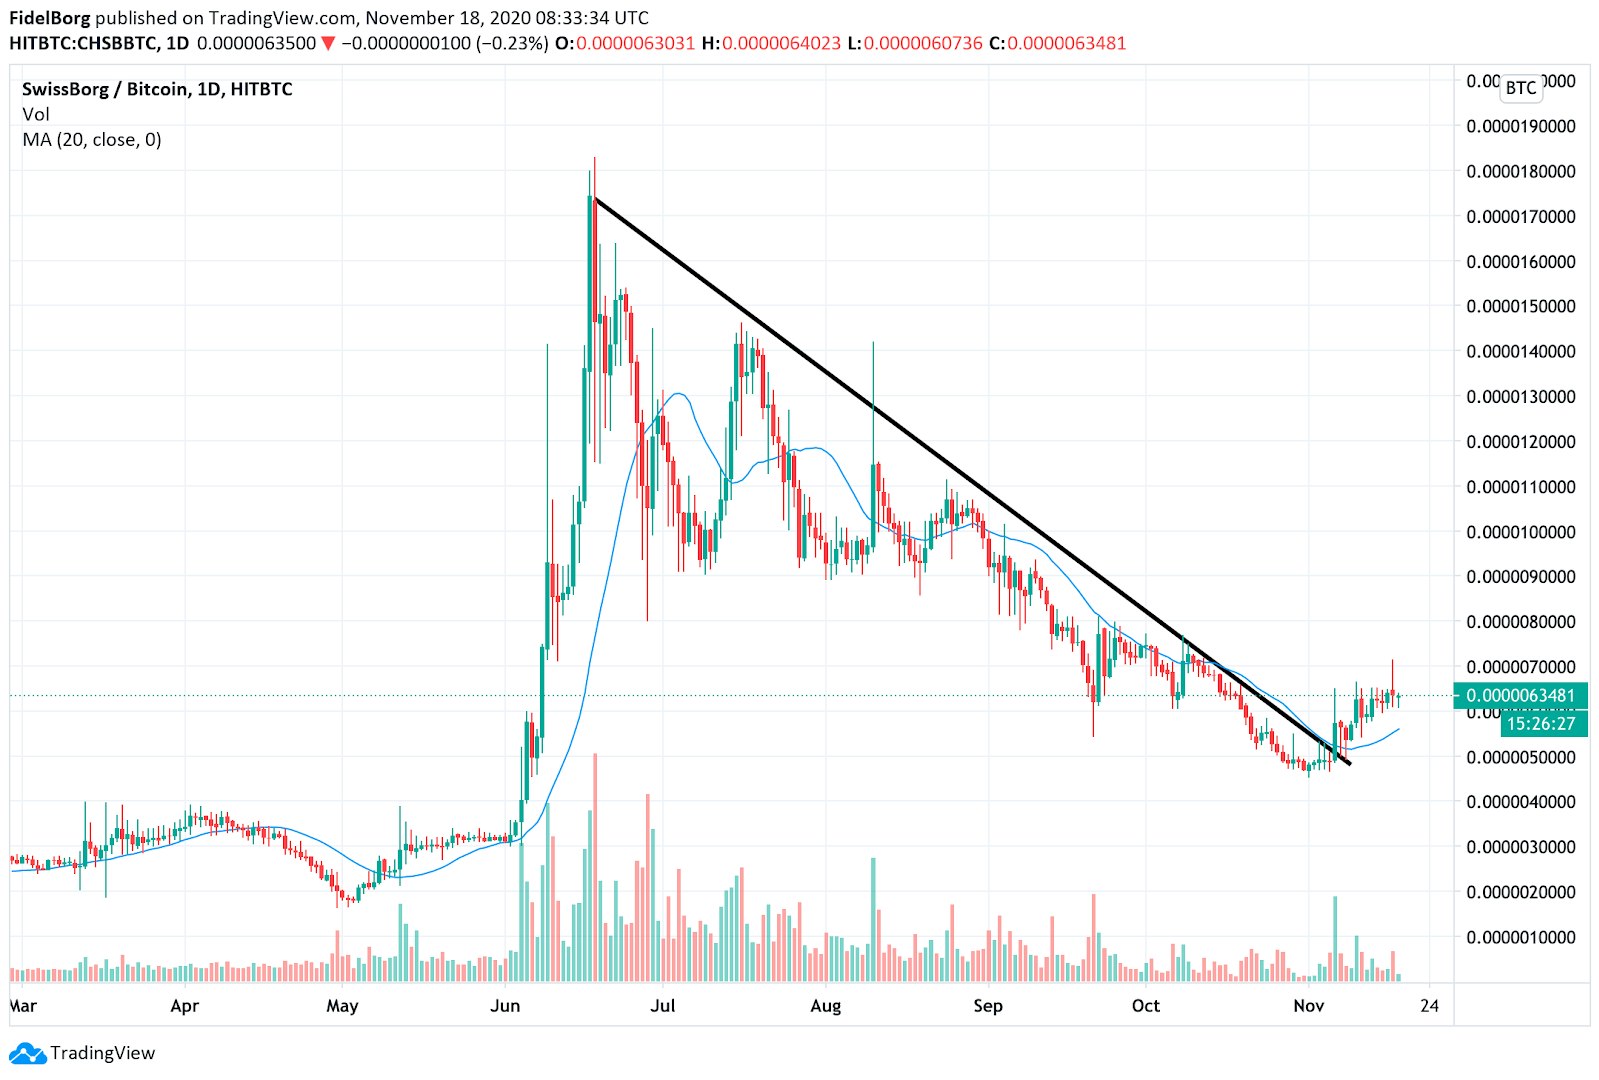
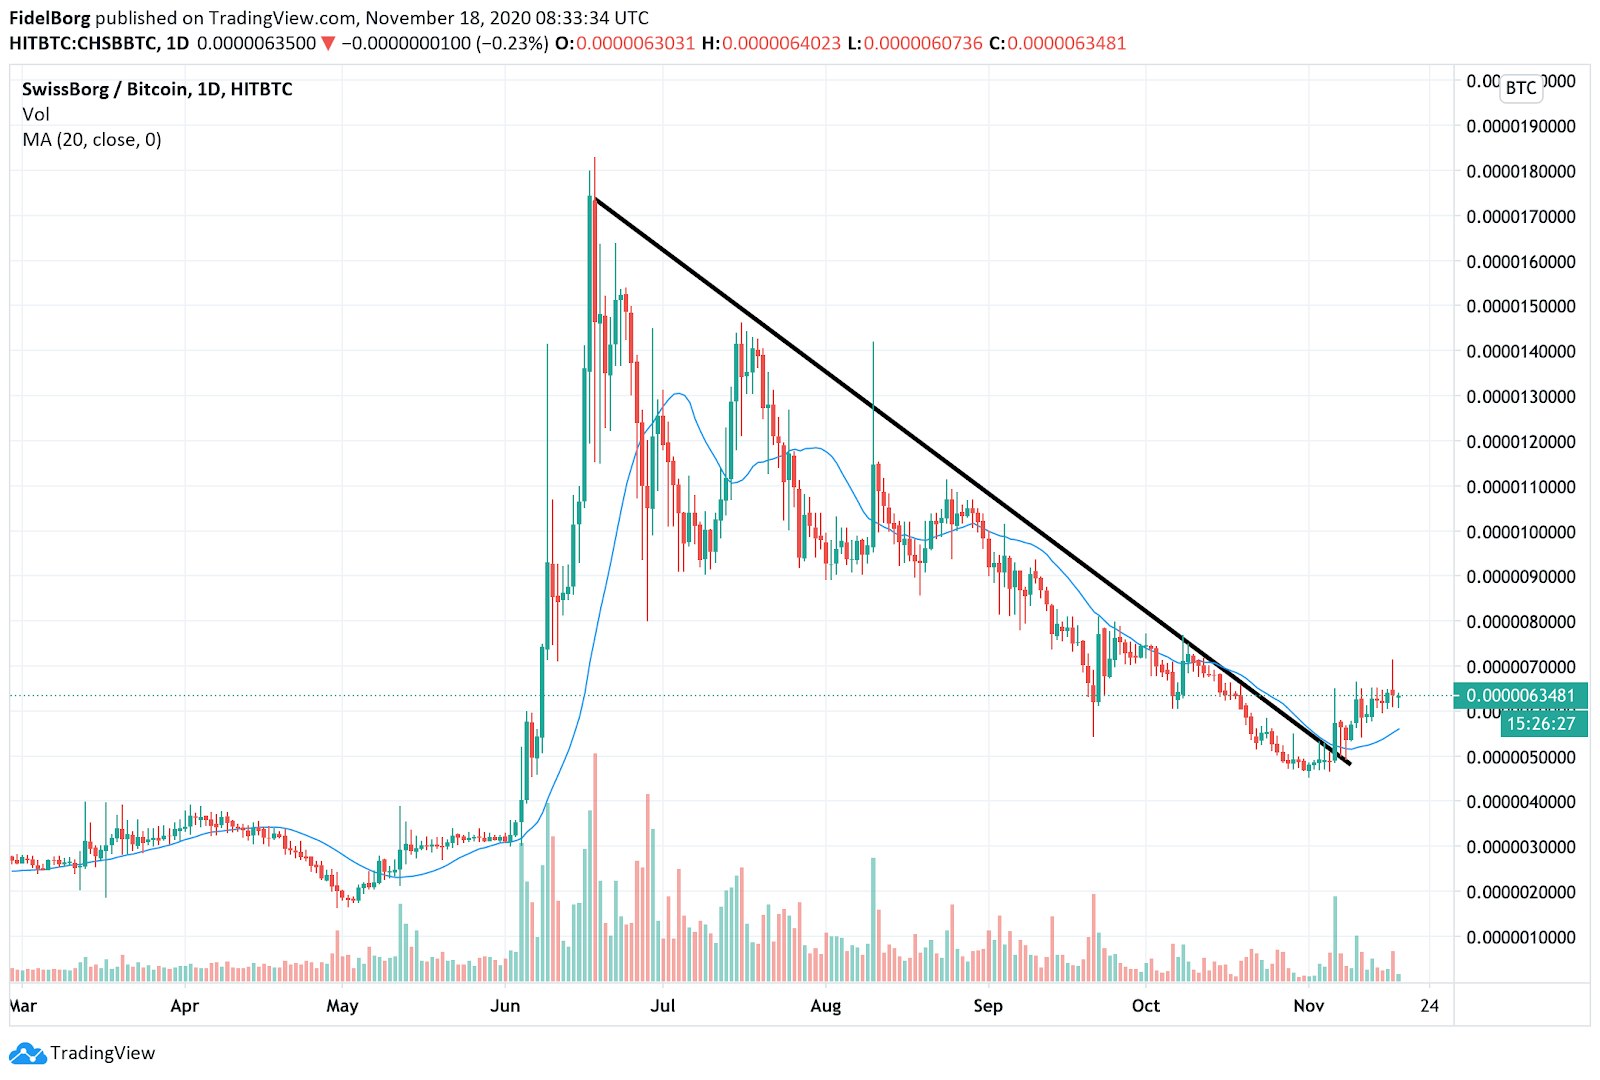
CHSB/BTC
The chart below shows the CHSB price in terms of Bitcoin and, by following the black line, it can be clearly observed that the CHSB price has broken above the downtrend line with CHSB holding above since early November and consolidating. The downtrend line of the CHSB/BTC pair had been in place since mid-June, so this breakout is a very healthy development for the CHSB. Despite Bitcoin having one of its strongest months of its recent history, the SwissBorg token has managed to outperform Bitcoin by 30% during the past month.
- Current price (18.11.2020): 0.0000063481 BTC or 635 satoshis
- Change in price (weekly): +1%
- Change in price (monthly): +31%
- Change in price (since Jan 1. 2020): +378%
CHSB/USD
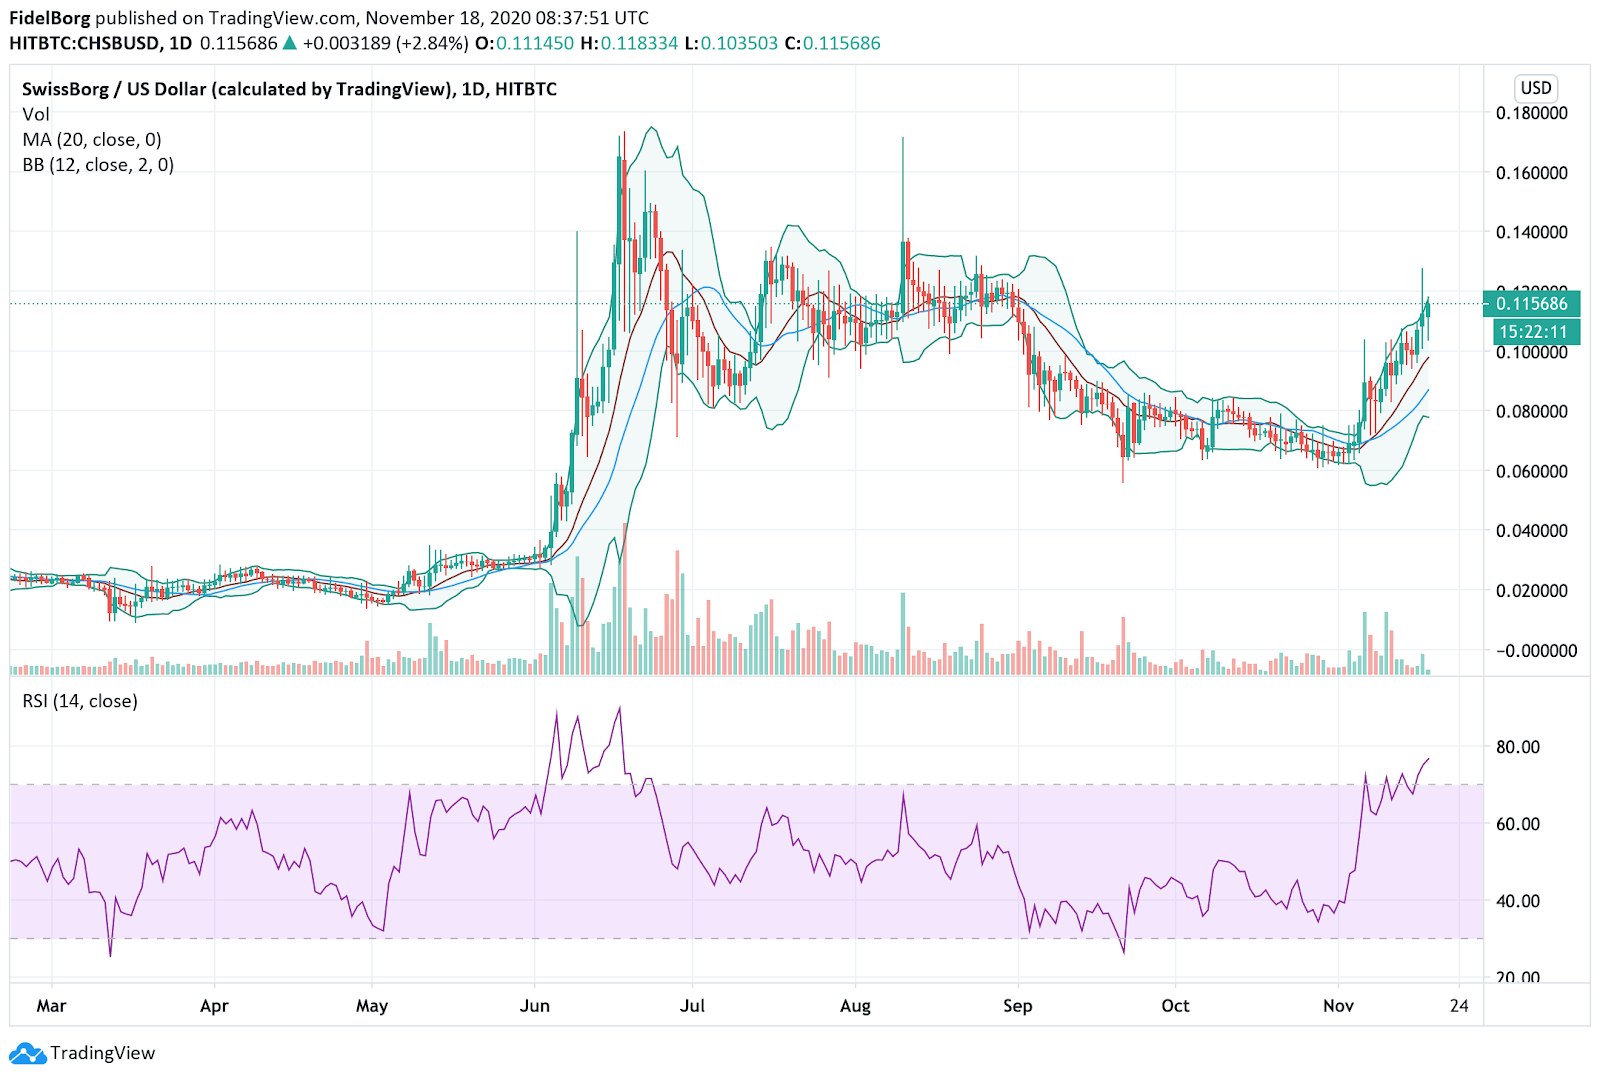
The chart below shows the last six months of CHSB performance measured in US Dollars and includes daily candlesticks, a 20-day moving average line in blue, bollinger bands, daily volume and RSI (Relative Strength Index) indicators at the bottom.
As shown in the chart, CHSB has had a phenomenal run since early November, gaining over 60% during this period. The current RSI is above 70, indicating overbought territory whereas the Bollinger bands (which are calculated as two standard deviations away from the 20-day moving average) show that the current price is hugging the upper band but not going decisively above or flattening down. This is a positive sign for trend-following as it means that the current uptrend is still in force. The current volume, although lower than at the peak in June-July 2020, is significantly higher than in October, which indicates increased trading interest and is bullish.
- Current price (18.11.2020): $0.115686
- Change in price (weekly): +23.3%
- Change in price (monthly): +54.2%
- Change in price (since Jan 1. 2020): +1112%

What could we expect for the future?
For CHSB to continue its ascent, it will have to break the $0.12 level, which is the level CHSB failed to sustain in early September after which the price dropped substantially. A break above the $0.12 level would then target the $0.136 level, which was the highest daily close during August 2020.
Our SwissBorg indicator, which can be accessed through the SwissBorg app and which measures medium-term trends, shows a bullish signal for the CHSB token.
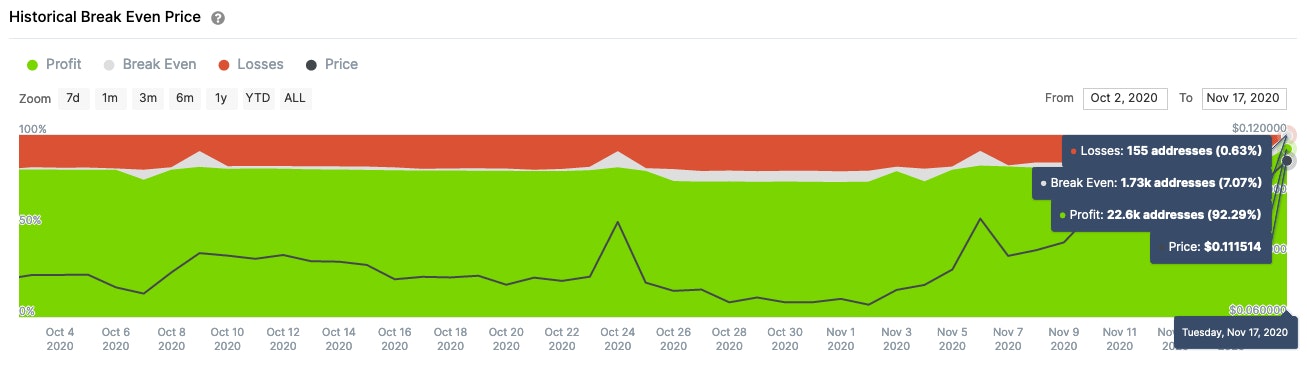
A network-level analysis of CHSB holders shows that at the current price:
- 92.3% of historical addresses are currently in profit
- 7.1% of addresses are breaking even
- Only 0.6% of addresses are at a loss
This is a bullish signal as it means that most CHSB holders are in profit territory, so it is unlikely that there will be a wall of sell orders if the SwissBorg token continues increasing in price. However, this can also result in some CHSB holders taking profit and moving to other tokens if CHSB loses its current momentum.

In the next few weeks, there is a clear price catalyst in the launch of the Smart Yield account, which could result in increased interest in the CHSB token as more users might stake the necessary CHSB to gain the advantages (doubling the yield) granted by going Premium. In addition, the interest around the Smart Yield account might bring new users to the SwissBorg app, which will lead to additional fees for the protect and burn mechanism and more awareness of the CHSB token.
What risks will CHSB have to overcome?
While CHSB has outperformed Bitcoin during these last few weeks, it is evident that CHSB is benefitting from Bitcoin’s latest uptrend. The current 30-day correlation between Bitcoin and CHSB is at 0.82 (where 1 is the maximum value) and CHSB has a higher beta than that of Bitcoin. As such, price declines in Bitcoin can negatively affect the CHSB token as well.
Conclusion
Currently, the price action of CHSB shows strong technicals, solid network analysis and a crucial catalyst on the horizon, which all point to bullish fundamentals. The SwissBorg token is going to experience some thrilling weeks ahead!
Want to keep up to date with CHSB’s latest metrics? See our CHSB overview page.
Ready to try your own CHSB analysis? Then download the SwissBorg app to try our free hourly asset analysis, which includes:
- The CyBorg Predictor - A machine-learning algorithm that forecasts the movements of assets like Bitcoin for the next 24 hours
- SwissBorg Indicator - A market-trend indicator that combines popular technical indicators
- Community Sentiment - A sentiment indicator based on the number of app users buying or selling
- Support/Resistance - Current price levels between which a price is ranging, where a break could signal a new trend
Download the SwissBorg app today to analyse what CHSB will do next!
Disclaimer: The information on this analysis is not targeted at the general public of any particular country. It is not intended to be distributed or used by residents of any country where such distribution or use would contravene any local law or regulatory requirement.
Any analysis, opinion, commentary or research-based material is for information and educational purposes only and is not, in any circumstances, intended to be an offer, recommendation or solicitation to buy or sell. You should always seek independent advice as to your suitability to speculate in any related markets and your ability to assume the associated risks if you are at all unsure. No representation or warranty is made, express or implied, that the materials are complete or accurate. We are not under any obligation to update any such material.
As such, we (and/or our associated companies) will not be responsible or liable for any loss or damage incurred by you or any third party arising out of, or in connection with, any use of the information on our Analysis (other than with regards to any duty or liability that we are unable to limit or exclude by law or under the applicable regulatory system) and any such liability is hereby expressly disclaimed.